Adoption of data center liquid cooling continues to gain momentum based on its ability to deliver more efficient and effective cooling of high-density IT racks. Yet, data center designers and operators have lacked data that could be used to project the impact of liquid cooling on data center efficiency and help them optimize the deployment of liquid cooling for energy efficiency.
To fill that void, a team of specialists from NVIDIA and Vertiv conducted the first major analysis of the impact of liquid cooling on data center PUE and energy consumption. The full analysis was published by the American Society of Mechanical Engineers (ASME) in the paper, Power Usage Effectiveness Analysis of a High-Density Air-Liquid Hybrid Cooled Data Center. This post summarizes the methodology, results, and key takeaways from that analysis.
Methodology for the Data Center Liquid Cooling Energy Efficiency Analysis
For our analysis, we chose a midsize (1-2 megawatt), Tier 2 data center in Baltimore, Maryland. The facility houses 50 high-density racks arranged in two rows. The baseline for the analysis was 100% air cooling provided by two chilled water, perimeter computer room air handler (CRAH) units with hot-aisle containment. The cooling units are supported by a Vertiv™ Liebert® AFC chiller with free cooling, adiabatic free cooling, hybrid cooling, and adiabatic mechanical cooling capabilities.
Liquid cooling is enabled by direct-to-chip cooling through micro channel cold plates mounted on major heat-generating IT components and supported by two Vertiv™ Liebert® XDU coolant distribution units (CDUs) with liquid-to-liquid heat exchangers.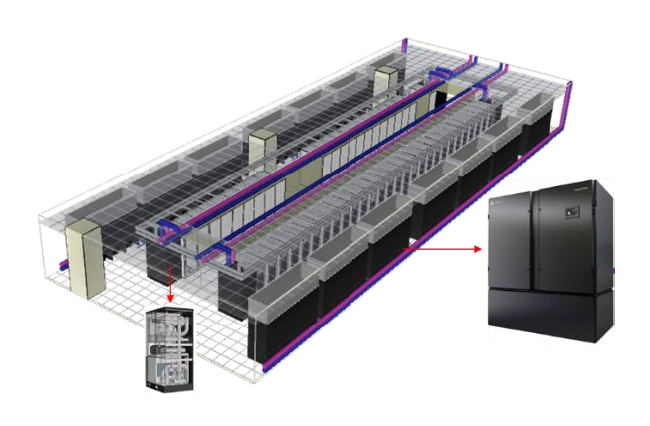
Schematic of data center used for the energy analysis featuring the Vertiv™ Liebert® XDU and Vertiv™ Liebert® PCW.
The analysis employed a “bottom up” approach by disaggregating the IT load into subsystems that enabled the impact of a progressive increase in the percent of the load cooled by liquid to be accurately calculated for each subsystem. We then ran four studies, increasing the percent of liquid cooling in each study while also implementing optimizations to chilled water temperature, supply air temperature, and secondary inlet temperature enabled by the use of liquid cooling.
- Study 1: 100% air cooling with a chilled water temperature of 7.2 degrees Celsius (45 Fahrenheit), supply air temperature of 25 C (77 F), and secondary inlet temperature of 32 C (89.6 F).
- Study 2: 61.4% of the load is cooled by liquid with 38.6% cooled by air. Chilled water temperature is raised to 18 C (64.4 F), supply air temperature is maintained at 25 C (77 F), and secondary inlet temperature is maintained at 32 C (89.6 F).
- Study 3: 68.6% of the load is cooled by liquid with 31.4% cooled by air. Chilled water temperature is raised to 25 C (77 F), supply air temperature is raised to 35 C (95 F), and secondary inlet temperature is maintained at 32 C (89.6 F).
- Study 4: 74.9% of the load is cooled by liquid and 25.1% by air. Chilled water temperature is maintained at 25 C (77 F), supply air temperature is maintained at 35 C (95 F), and secondary inlet temperature is raised to 45 C (113 F).
Impact of the Introduction of Liquid Cooling on Data Center Energy Consumption and PUE
The full implementation of liquid cooling in Study 4 (74.9%) produced an 18.1% reduction in facility power and a 10.2% reduction in total data center power compared to 100% air cooling. This has the effect of not only reducing data energy costs by 10% annually, but for data centers using carbon-based energy sources, reducing Scope 2 emissions by the same amount.
Total data center power was reduced with each increase in the percent of the load cooled by direct-to-chip cooling. From Study 1 to 2, power consumption was cut by 6.4%; an additional 1.8% reduction was achieved between Study 2 and 3; and another 2.5% improvement was seen between Study 3 and 4.
Based on those results, the data center PUE calculated for each study may prove surprising. The PUE fell only 3.3%, from 1.38 in Study 1 to 1.34 in Study 4 and actually remained flat at 1.35 for Studies 2 and 3.
If you’re familiar with how PUE is calculated, you may already have guessed the reason for this discrepancy. PUE is essentially a measure of infrastructure efficiency that is calculated by dividing total data center power by IT power. But liquid cooling didn’t just reduce consumption on the facility side, it also reduced IT power consumption (per the PUE definition) by reducing demand on server fans.

Server fan power consumption decreased by 41% between Study 1 and Study 2, and 80% between Study 1 and Study 4. This resulted in a 7% reduction in IT power between Study 1 and 4.
Unlike air cooling, liquid cooling effects both the numerator (total data center power) and the denominator (IT equipment power) in the PUE calculation, which makes it ineffective for comparing the efficiency of liquid and air-cooling systems.
In our paper, we propose Total Usage Effectiveness (TUE) as a better metric for this purpose and I’ll explain why this decision was made in a follow-up post. The TUE for the data center that was the subject of our analysis improved 15.5% between Study 1 and 4, which we believe is an accurate measure of the gains in data center efficiency achieved through the optimized liquid cooling deployment.
Key Takeaways From the Data Center Liquid Cooling Energy Efficiency Analysis
The analysis provided multiple insights into the efficiency of data center liquid cooling and how it can be optimized. I’d encourage data center designers, in particular, to read the full paper, which includes the supporting data that was used to derive the results stated in the previous section. Here are some of the key takeaways that might be of interest to a broader audience.
- In high-density data centers, liquid cooling delivers improvements in the energy efficiency of IT and facility systems compared to air cooling. In our fully optimized study, the introduction of liquid cooling created a 10.2% reduction in total data center power and a more than 15% improvement in TUE.
- Maximizing the data center liquid cooling implementation — in terms of the percent of the IT load cooled by liquid — delivers the highest efficiency. With direct-to-chip cooling, it isn’t possible to cool the entire load with liquid, but approximately 75% of the load can be effectively cooled by direct-to-chip liquid cooling.
- Liquid cooling can enable higher chilled water, supply air, and secondary inlet temperatures that maximize the efficiency of facility infrastructure. Hot water cooling, in particular, should be considered. Secondary inlet temperatures in our final study were raised to 45 C (113 F) and this contributed to the results achieved while also increasing opportunities for waste heat reuse.
- PUE is not a good measure of data center liquid cooling efficiency, and alternate metrics such as TUE will prove more helpful in guiding design decisions related to the introduction of liquid cooling in an air-cooled data center.
Finally, I want to thank my colleagues at Vertiv and NVIDIA for their work on this groundbreaking analysis. The findings not only quantify the energy savings that can be achieved through liquid cooling but provide designers with valuable data that can be used to optimize data center liquid cooling installations.
For more on the trends driving adoption of liquid cooling, see the blog post, Liquid Cooling: Data Center Solutions for High-Density Compute, that summarizes the insights from a panel of liquid cooling experts at the 2022 OCP Global Summit.